Product overview

Evaluate carbon accounting against the way your team already works

Karvoix is built around recorded activity data, factor-backed calculation context, and readable review surfaces so teams can see how carbon accounting would work in practice, not just in theory.

Most teams reach this step when spreadsheet-based reporting starts to require repeated explanation or reconstruction.

Karvoix dashboard overview showing emissions visibility and status cards.

How Karvoix works in practice

Karvoix is a working carbon accounting platform for recorded activity data, factor-backed calculation, review, reporting, and traceability. This page focuses on what the workflow looks like in use. This is what removes the need to rebuild logic each reporting cycle.

Step 1 — Capture activity data

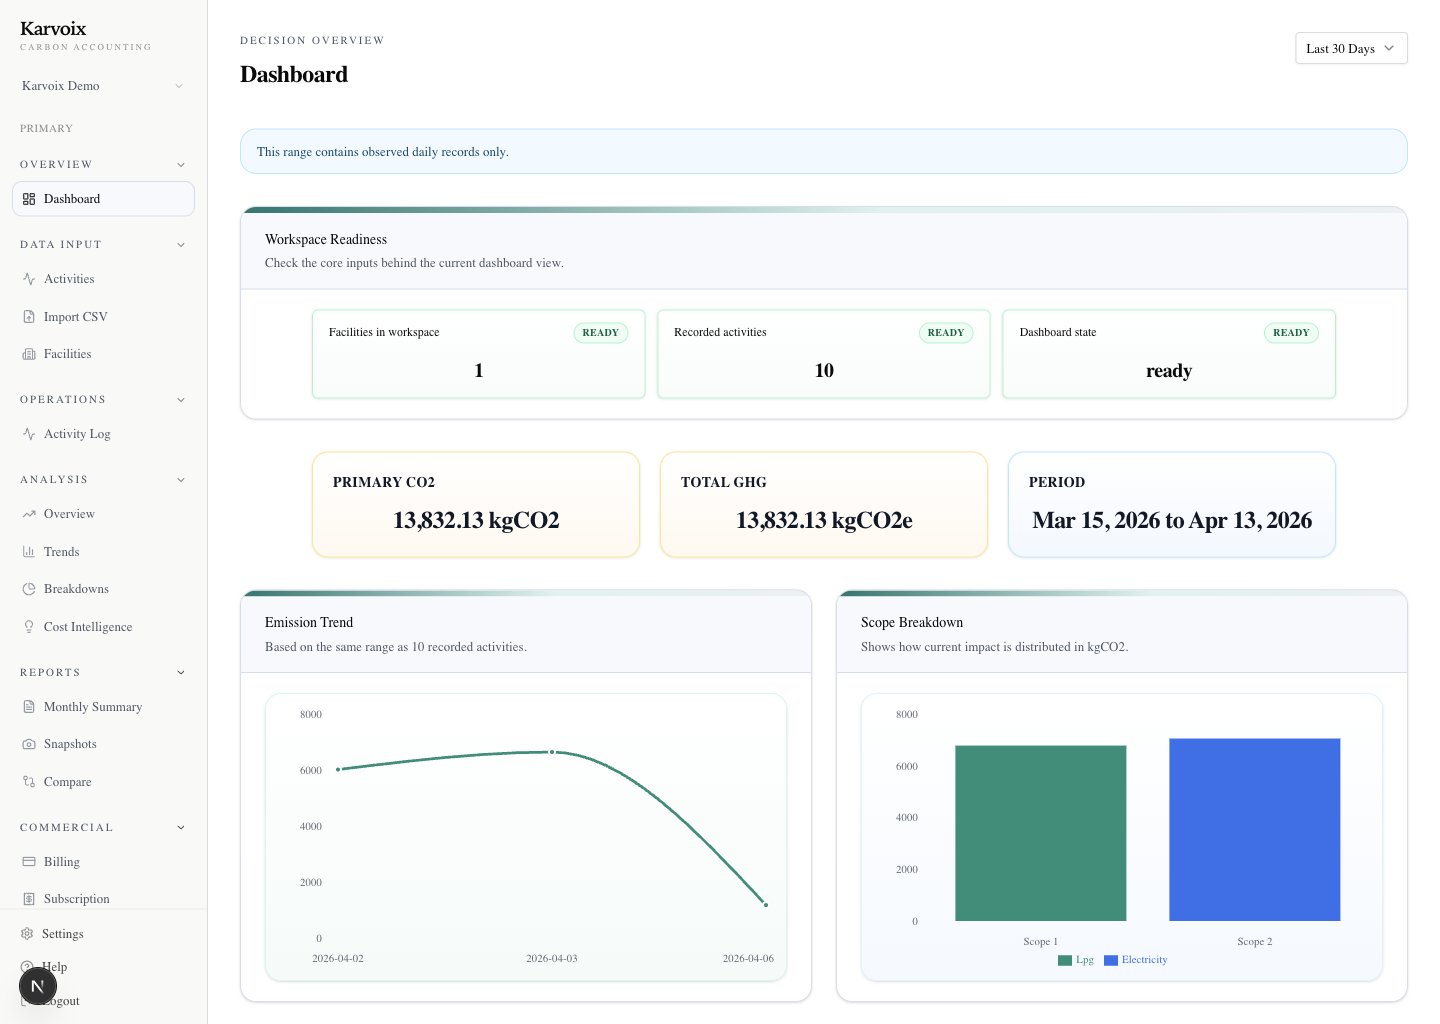
Teams start with the operating records behind the number, such as electricity usage, fuel consumption, or logistics activity. Instead of scattering those records across separate sheets, they live in one structured workspace tied to the facility or reporting context.

  • Capture fuel, electricity, logistics, and similar activity in one place
  • Keep the records structured by workspace and operating context
  • Avoid spreadsheet collection that drifts across tabs and owners

Step 2 — Apply factor-backed calculations

Karvoix applies factor-backed carbon calculations using region-appropriate emission factors where applicable. The calculation basis stays visible next to the result, so teams are not forced to decode formulas or side notes during review.

  • Use region-appropriate factor-backed workflows where applicable
  • Keep the factor basis visible alongside the result
  • Review calculation context more easily than spreadsheet formulas

Step 3 — Review and trace results

Users can review totals, contributors, and movement over time from the same product flow. That makes it easier to inspect what changed, challenge a number with context, and reduce back-and-forth between finance, sustainability, and operations.

  • Inspect totals, contributors, and changes without leaving the workflow
  • Click into the number with its supporting basis still visible
  • Reduce internal back-and-forth caused by fragmented review

Step 4 — Generate reporting outputs

Reports and snapshots come from the same structured workflow used for calculation and review. That means reporting outputs stay tied to the underlying activity data and are easier to recreate in the next reporting cycle.

  • Create snapshots and structured reports from the same workflow
  • Keep outputs connected to source activity and review logic
  • Make recurring reporting more repeatable than manual exports

The best way to evaluate fit is to compare your current reporting process against these workflow steps and review surfaces.

No preparation needed. Bring your current process or questions — we’ll walk through it together.

Differentiation in practice

What becomes easier to inspect inside the product

The difference from spreadsheets is not abstract. It shows up in what users can inspect, what stays connected, and what no longer needs to be reconstructed during review. Instead of reconstructing numbers from formulas and notes, teams can review results with their full calculation context still intact.

A number keeps its calculation basis nearby

Instead of hunting across formulas and notes, teams can review a reported figure with factor-backed context still visible in the same workflow.

Activity data and outputs stay connected

The workflow keeps recorded activity, calculated results, and reporting outputs tied together, so review does not depend on manual cross-checking between files.

Changes remain visible in one review flow

When results move between periods, teams can inspect the change inside the same product flow instead of tracing version differences by hand.

Carbon Operations API

A narrow API baseline for teams that need carbon data inside real systems

Karvoix now has a phase-1 public integration baseline built for controlled rollout. It is not a full public developer platform, but it is a real backend-backed surface teams can use today to start serious pilot integration work.

Track fuel usage without waiting for spreadsheet updates

Use the calculate API to send activity directly from internal systems instead of rebuilding reporting inputs by hand first.

Bring ERP activity into the same carbon workflow

Start with activity submission, facility support, and readback so carbon truth sits closer to the operational system that produced it.

Use CSV upload when direct API rollout is not ready yet

The CSV validate/import baseline provides a guarded fallback when teams need a controlled path before broader system integration.

Build internal carbon reporting pipelines on persisted truth

Read activity back, inspect ledger trace, and connect internal reporting pipelines on top of a narrow but usable baseline.

Proof of reality

Developers can already start pilot integration from a real backend surface

Example request

POST /api/public/v1/calculate
{
  "facility_id": "fac_001",
  "activity_type": "fuel",
  "amount": 1200,
  "unit": "liters"
}

Example response

{
  "co2e": 3210.44,
  "activity_id": "act_123",
  "ledger_entry_id": "led_456"
}

This is a curated public OpenAPI subset for phase-1 only, designed around controlled rollout, machine-authenticated access, and explicit scope guardrails.

Quickstart, API reference, and developer surfaces are shared during controlled pilot onboarding.

Product proof

Real product surfaces that help buyers evaluate the workflow seriously

These screenshots come from the real product flow so buyers can assess the actual review surfaces, reporting rhythm, and workflow clarity rather than abstract mockups.

Karvoix dashboard overview showing emissions visibility and status cards.

What teams review

Review headline totals, recent movement, and what needs attention next

This is the first screen a reviewer can use to see the current emissions picture, spot movement versus prior periods, and decide where to look deeper without reopening multiple spreadsheets.

Karvoix analysis view showing contributor charts and emissions breakdowns.

What changed

Inspect contributors, categories, and changes behind the total

Users can review which categories and contributors are driving the number, then discuss the result with more context than a static total in a reporting workbook.

Karvoix reports center showing report tables and status information.

What gets reported

Generate snapshots and reports from the same reviewed workflow

The reporting view shows how summaries and snapshots stay tied to the workflow that produced them, making recurring reporting more repeatable than manual exports.

Karvoix team management view showing invited members and workspace roles.

Who reviews together

Support finance, sustainability, and operations in one environment

This surface shows that carbon accounting review does not have to live with one person or one spreadsheet owner. Teams can work from a shared environment instead.

Karvoix integrations overview showing available connections and setup status.

What can grow later

Leave room for a broader operating data process

The integrations view signals that Karvoix is meant to sit inside a wider reporting process rather than forcing teams to rebuild context outside the product.

Value in practice

What improves in day-to-day reporting work

These outcomes are tied to actual workflow moments rather than generic product benefits. These improvements come from keeping activity data, calculations, and reporting connected — not from adding more tools.

Less time checking formulas before review

Because calculation context stays visible, teams spend less time reopening spreadsheets to understand how a number was derived.

Fewer version conflicts during recurring reporting

A structured workflow reduces the need to reconcile multiple files and reduces uncertainty about which version should be reviewed.

Faster internal review discussions

Totals, contributors, and changes can be discussed from one product flow instead of being reassembled across email threads and notes.

Clearer reporting discussions before outputs are shared

Reports stay tied to the workflow that produced them, making it easier to explain what is being reported and why.

User scenarios

How different teams would use Karvoix

These short scenarios show how the product fits into real reporting work across different internal roles.

Finance reviewing monthly emissions

Finance can start from current totals, inspect movement versus the prior period, and review the basis of a number without reopening a workbook full of formulas.

Operations uploading activity data

Operations teams can add or import fuel, electricity, or logistics activity into a structured workspace instead of updating separate tracking files for each reporting cycle.

Sustainability preparing reporting outputs

Sustainability teams can move from reviewed results into snapshots and reporting outputs that remain connected to the underlying activity and calculation context.

Evaluation path

Evaluate the workflow against the way your team already works.

Bring your current process, reporting questions, or first activity data examples. We will review how Karvoix supports calculation, review, reporting, and fit in a focused 30 to 45 minute session.

Teams typically use this session to decide whether they can move away from spreadsheet-based reconstruction.

No preparation needed. Bring your current process or questions — we’ll walk through it together.

Start With Clarity

Move from scattered carbon tracking to a clearer carbon accounting review flow.

Use Karvoix to record activity, calculate emissions, inspect drivers, and review traceable results with more confidence.

Start with a pilot review or reach out directly if you want to evaluate fit before broader rollout.